As communities expand investments in active mobility and public transit, a persistent challenge remains: bike networks and transit systems are often planned as parallel efforts rather than a single, connected experience for riders.
Individually, each system may function well, but at their intersections – particularly near transit stations where demand and different modes converge – misalignment can introduce safety risks and create last‑mile gaps that limit access and discourage multimodal travel.
At STV, our planning, engineering and digital teams increasingly see these gaps not as isolated design issues, but as system‑level challenges that require integrated analysis, cross‑disciplinary collaboration and a clear line of sight to implementation.
Conventional mapping helps planners understand where infrastructure exists. What it rarely explains is how people move between systems, where risk is concentrated in meaningful ways and which locations matter most for near‑term action. Geospatial data science bridges that gap: shifting planning from static visualization to evidence‑based prioritization, ultimately supporting clearer decisions about where investment can make the greatest difference.
This shift aligns with STV’s broader approach to transportation planning: pairing technical rigor with applied judgment to help agencies move from documentation to defensible, action‑oriented outcomes. These conditions underscore the need to cut across traditional planning silos – an area where STV’s multidisciplinary structure allows data, engineering insight and implementation experience to inform decisions together, not sequentially.
The Challenge: Multimodal Networks, Fragmented Planning
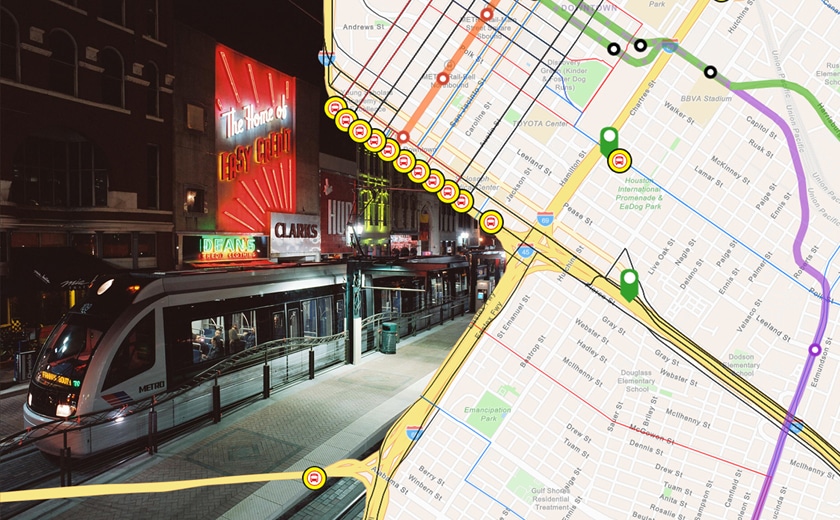
In urban, suburban and campus environments alike, bicycling often plays a critical role in completing transit trips, with “first-and-last mile” integration increasing transit accessibility by more than 40% in some areas.
Yet the areas where biking and transit converge are frequently the most complex and least coordinated. Discontinuous bike facilities, unclear station access and high‑conflict crossings can elevate crash risk, slow trips and undermine confidence for riders navigating between modes.
Through our work with transit agencies, municipalities and institutional clients, STV teams routinely encounter these conditions at the exact locations where safety expectations are highest: station entrances, transfer points and shared corridors that serve multiple user types.
These challenges are not confined to large metropolitan systems. Smaller cities, university communities and visitor‑oriented destinations face similar challenges: often with fewer resources and incomplete or inconsistent datasets.
In these contexts, the question is rarely whether improvements are needed. It is about prioritizing limited funding, coordinating across agencies and advancing solutions that can realistically move into design and delivery.
An Integrated, Evidence‑Based Approach
The planning question is less about whether improvements are needed and more about where targeted investment will deliver the greatest impact.
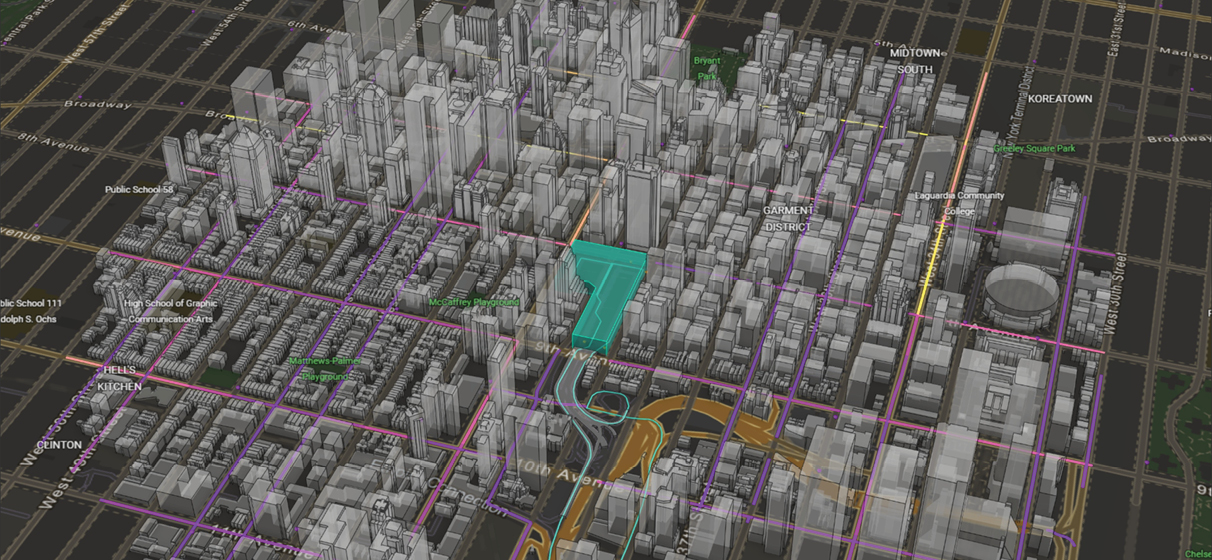
In recent STV analyses, our team used geospatial data science as a unifying framework – bringing together safety, access and land-use context to reflect how people actually move through space, rather than how systems are organized on paper. Instead of evaluating datasets independently, this approach highlights priority locations where design, policy or operational changes can reduce risk and improve connectivity.
Integrated Data Inputs include:
- Transit station access points
- On‑street and off‑street bicycle infrastructure
- Reported bicycle crash data
- Census and planning geographies
- Bikeability indicators derived from third‑party scoring tools
By distinguishing meaningful patterns from random variation, spatial statistics help agencies prioritize improvements with greater confidence, particularly when funding and implementation windows are limited.
For STV, this analytical approach delivers the most value when it supports shared decision‑making – giving planners, engineers and agency leaders a common evidence base from which to align priorities and move forward together.
Turning Analysis into Action
Interactive dashboards and geospatial storytelling tools allow planners, engineers and policymakers to explore findings together, test assumptions and understand tradeoffs. Unlike static exhibits, these platforms promote collaboration across disciplines and help translate technical analysis into clear, defensible strategies that can move into design and delivery.
This emphasis on translation – from analysis to action – reflects STV’s long‑standing role as a partner, not just an analyst. By structuring insights around real‑world constraints such as capital programs, grant cycles and phasing considerations, geospatial tools become a practical bridge between planning and implementation.
By making complexity accessible, visual storytelling helps bridge the gap between data science and implementation, supporting solutions that are both technically sound and community‑centered.
When multimodal data is integrated and analyzed through a spatial lens, planners can move from documenting conditions to shaping more connected outcomes.
Used thoughtfully, geospatial data science becomes more than a mapping exercise. It becomes a decision‑support tool – one that helps communities align investments, reduce risk at critical interfaces and design transportation systems that work better together.
This is where STV’s combination of technical expertise, partnership-driven delivery and community-focused purpose comes into focus: helping clients navigate complexity with clarity, confidence and a long-term commitment to making communities safer and more connected.