COVID-19’s profound impacts on our daily way of life are well documented. But while conducting research for a sewer basin improvement program in York County, SC, our project team made some unexpected discoveries regarding wastewater discharge patterns during the height of the pandemic.
In recent years, York County, a residential and commercial area just south of Charlotte, NC, has seen its population rise exponentially, necessitating evaluation of its sewer infrastructure. Prior to the onset of pandemic, STV was contracted by York County to study, model and make recommendations for capacity improvements for the Blankmanship Basin, a 2,500-acre sewershed that drains into the 36-inch Steele Creek interceptor sewer just east of Interstate 77 and situated in a primarily residential area with small pockets of businesses.
As part of STV’s study, our team evaluated the performance of the Blankmanship sub-basin’s existing conditions, as well as a project year 2040 build-out using a calibrated dynamic hydraulic model to identify current and future capacity limitations, as well as future system improvement alternatives for wastewater collection upon basin build-out. A temporary flow metering study was then conducted from September through December of 2020 with five flow meters installed in strategically picked manholes. Flows were remotely monitored by a subconsultant with data collection at 5-minute intervals and compiled to 15-minute and 1-hour averages. Population and flow projections were conducted to determine basin buildout with input from York County.

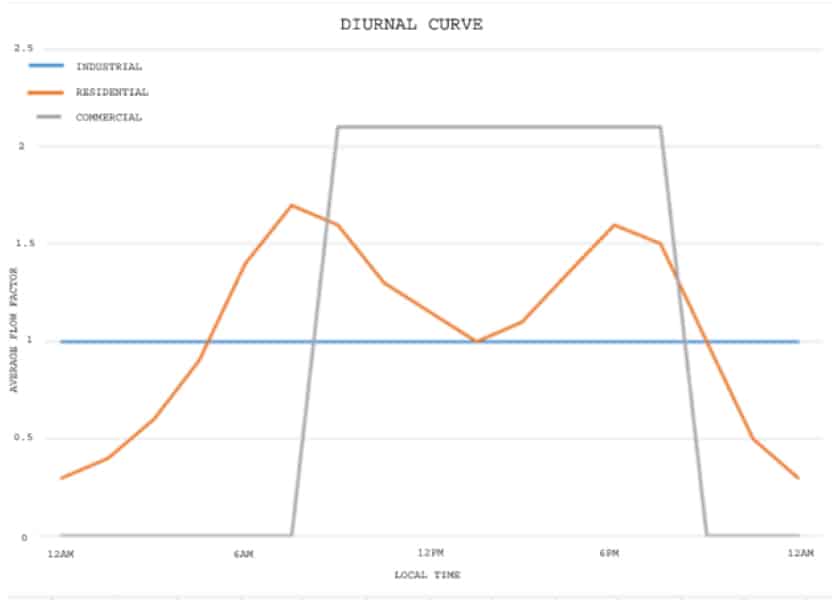
General diurnal flow curve for a sewer basin
It was when analyzing the flow metering data that STV’s team was caught by surprise. Typically, wastewater flows generally follow a daily or diurnal pattern – flows are traditionally lower between midnight and 3-5 a.m., then increase to a morning peak, drop off as people go to work, more gently spike again in the late afternoon and evenings, and then fall off as people go to sleep.
Additional considerations include whether we’re studying a commercial area where there is a more constant day-long peak with businesses operating from 8 a.m. to 6 p.m. (or later if the study area includes restaurants). Flows in industrial areas vary based on how many shifts are working and whether it’s a round-the-clock operation.
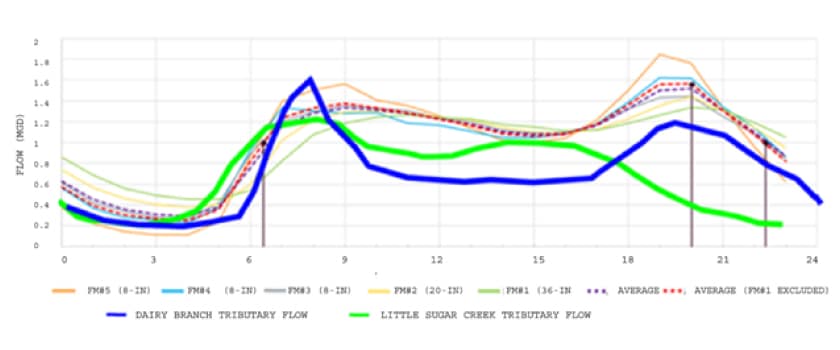
These “typical” diurnal curves were confirmed by previous studies we conducted in 2016 on behalf of Charlotte Water for the Little Sugar Creek Tributary and the Dairy Branch Tributary basins.
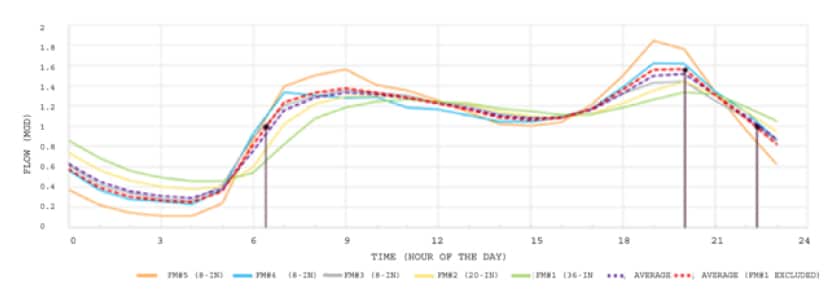
However, what we found at the Blankmanship sub-basin was not aligned with our previous studies. With much of the country either working from home or locked down during the height of COVID-19, the patterns of water usage and wastewater discharge changed significantly. Presumably, with residents not following a typical “9-to-5” schedule and likely showering and eating later in the morning, our analysis showed a much flatter diurnal curve than expected. Additionally, during this period, residents were more apt to wash clothes, eat, or use water in other ways, over the course of the entire day, spreading the flow out further. Meanwhile, with many commercial businesses closed, they did not contribute to any of the flow data.

Blankmanship Basin diurnal curve
The team did find that there was still a semblance of a peak early in the evening. The belief here was that residents were keeping a regular evening schedule – i.e. having dinner or bathing children at the same time as before the pandemic – to maintain some semblance of normalcy.
While this was a unique and interesting representation of how water usage habits overlapped with wastewater discharge patterns, our team still had to figure out a way to leverage data to make an informed decision about infrastructure improvements for the county. With no pre-COVID flow data available for the Blankmanship basin, our team chose to superimpose the Dairy Branch and Little Sugar Creek basin diurnal curves on top of the Blankmanship data. Dairy Branch specifically is of similar size and length to Blankmanship.

Blankmanship Basin diurnal curve with Little Sugar Creek Tributary and Dairy Branch Tributary
Using that data and the assumption that some sense of “normalcy” would return following the easing of in-person restrictions and more people returning to the office in the coming months and years, STV was able to provide several options to meet buildout development flows, including replacing the trunk sewer with a larger sewer, paralleling the existing sewer with a deeper relief sewer, or installing a force main to bypass the flow restrictions to a point downstream. Additionally, we recommended future flow monitoring in the same locations to account for ongoing development in the basin.
While the data was collected during the pandemic did not ultimately impact our final recommendations, the shifts in the diurnal curve was just another fascinating reminder of how much changed in our daily lives during this extraordinary moment in history.


